Structured logging in ASP.NET Core using Serilog and Seq
Estimated reading time: 50 minutes
- Context
- What is unstructured logging?
- What is structured logging?
- Why should I use structured logging?
- What is Serilog?
- What is Seq?
- Log application events
- Use cases
- References
- Conclusion
Context
Back in 2016 I was part of a team developing an e-care web application using SAP Hybris platform for an European telco. Among many other things, I was tasked with the initial deployment to the UAT environment which was supposed to be promoted to production as soon as the client would have validated that particular release. The web application was running in a Tomcat cluster made out of 8 or 9 Linux servers which I was able to access via SSH only, thus in order to investigate any issue occurring on that particular environment, I had to run specific Linux commands inside the console to search for relevant lines of text found inside application log files - if I remember correctly, we were using less command.
One of my colleagues had a MacBook Pro and with the help of iterm2 he was able to split his window into one pane per server and run each command against all of them at the same time; unfortunately for me, I was using a laptop running Windows, so I had to open one console per server and run each command inside each console which was a very time consuming and error prone activity.
There were two particular issues with this approach (beside lack of productivity due to dealing with multiple consoles): any real-time investigation was limited by Linux CLI support for searching text files and when any more offline advanced investigation was needed, we had to ask the client IT department to send us specific log files and use a text editor like Notepad++ to search across several files. These issues are direct consequences of employing unstructured logging when dealing with application events.
The purpose of this post is to present a way to create and query application events using the structured logging mechanism provided by ASP.NET Core, with the help of Serilog and Seq.
All code fragments found in this post are part of my pet project aspnet-core-logging; furthermore, I have created a tag to ensure these fragments will remain the same, no matter how this project will evolve in the future.
What is unstructured logging?
Creating an application event is usually done by instantiating a string, maybe using string interpolation and then sending it to a console, file or database using a logging library like Log4Net; an educated developer might even check whether the logging library has been configured to log that particular event before creating it to avoid waisting time and resources - see more details about such approach inside the Performance section of the article found here.
This approach is called logging, since we keep a log of events. As the events have been created using plain text, when we need to search for specific data inside the log, we usually resort to the basic search feature offered by the text editor at hand or maybe regular expressions. Neither approach is suitable for complex searches - a text editor can only search for words contained inside the events stored in one or more files, while writing a custom regex to fetch specific data is not an easy task, plus searching through all events means you need to access all log files, a feat which might involve terrabytes of data or even more; also, how would you write a regex to answer a question like: What events created during this specific time range contain (or do not contain) this particular pieces of information?
This is unstructured logging, since an event is just a line of text which does not have any structure.
What is structured logging?
Structured logging means creating events having a particular structure; such data can then be ingested by another service which offers the means to parse, index and finally query it.
ASP.NET Core was built having structure logging in mind with the help of logging providers, message templates and log scopes.
Several years ago I stumbled upon one of Nicholas Blumhardt’s answers on the internet which really got me thinking about structured logging. It took me years to finally have the opportunity of using it in a commercial project, but after using it, I strongly believe it’s a game changer!
Why should I use structured logging?
The short answer is: be able to (quickly) answer (almost) any business or technical question about your application behavior, its data and its users.
Read the rest of this post for the longer answer.
What is Serilog?
ASP.NET Core provides several built-in logging providers and when I have initially started using this framework, as I was already familiar with Log4Net, I employed the Microsoft.Extensions.Logging.Log4Net.AspNetCore NuGet package - that was mid 2018. Several months later, I stumbled upon Serilog and Seq and I was blown away by this very powerful combination.
Serilog is a logging framework with powerful structured event data in mind (as stated on its home page) which was initially released as a NuGet package in 2013. One uses Serilog to create events having a given structure and stores them in specific place, like a file or database. Serilog uses several nouns, like: sinks, enrichers, properties, destructuring policies and others, at the same time offering the means to configure its behavior either via code-based or file-based configuration sources.
The community around this library is pretty solid, as seen on NuGet gallery, so one more reason to make Serilog my preferred logging framework!
Serilog sinks
A Serilog sink is a component which receives events generated via Serilog and stores them or sends them over to other components which will further process these events. There are plenty of such sinks, ready to support almost any given scenario - see the official list here. If this list does not cover your scenario, you can always write your own sink by starting from an already implemented one or from scratch! Of course, there are many more sinks, as one can see by querying GitHub.
In 2019 I joined a team developing a deal advisory management application running in Azure where we had 3 web APIs, each one writing events during local development to its own file. Each developer had to search through several files in order to investigate a particular issue or to find a relevant piece of information, a thing which was neither comfortable, nor quick.
After discovering Seq, I’m now strongly recommending using it for local development via Serilog.Sinks.Seq sink - this enables sending events from the application to a running Seq instance (most likely a Docker container running on local machine) which will ingest them and then provide the means to perform rather complex queries against all events, thus avoiding the overhead and performance penalty caused by logging to files.
In case the application production environment (or any remote environment, for that matter) is hosted by a cloud provider, I strongly recommend using the Serilog sink which integrates with the logging/monitoring service of that particular provider - e.g. one could pair Serilog.Sinks.ApplicationInsights with Azure, Serilog Sink for AWS CloudWatch with AWS and Serilog.Sinks.GoogleCloudLogging with GCP, etc.
Outside cloud, one could use Seq for all environments, which comes with the benefit of having to learn only one query language instead of two.
Here’s a fragment found inside appsettings.Development.json file configuring Serilog sinks when application runs locally:
"Serilog": {
  ...
  "Using": [
    "Serilog.Sinks.Console",
    "Serilog.Sinks.Seq"
  ],
  "WriteTo": [
   {
      "Name": "Console",
      "Args": {
        "theme": "Serilog.Sinks.SystemConsole.Themes.AnsiConsoleTheme::Code, Serilog.Sinks.Console",
        "outputTemplate": "{Timestamp:HH:mm:ss.fff} {Level:u3} | cid:{ConversationId} fid:{ApplicationFlowName} tid:{ThreadId} | {SourceContext}{NewLine}{Message:lj}{NewLine}{Exception}"
      }
   },
   {
      "Name": "Seq",
      "Args": {
        "serverUrl": "http://localhost:5341",
        "controlLevelSwitch": "$controlSwitch"
      }
   }
  ],
  ...
And here’s a fragment found inside appsettings.DemoInAzure.json file configuring the only Serilog sink used when application runs in Azure:
"Serilog": {
  ...
  "Using": [
    "Serilog.Sinks.ApplicationInsights"
  ],
  "WriteTo": [
   {
      "Name": "ApplicationInsights",
      "Args": {
        "telemetryConverter": "Serilog.Sinks.ApplicationInsights.Sinks.ApplicationInsights.TelemetryConverters.TraceTelemetryConverter, Serilog.Sinks.ApplicationInsights"
      }
   }
  ],
  ...
There are several important things worth mentioning:
- We usually need to install one NuGet package per sink, so just declaring them under the
Usingsection is not enough - Each sink has its own list of configuration properties which must be declared under the
Argssection, but usually the GitHub repo of each Serilog sink states how to configure it, so it shouldn’t be that hard to properly set it up- The
Consolesink uses several placeholders found under itsArgssection:Timestamprepresents the date and time when the event was createdLevelrepresents the logging level associated with the eventSourceContextrepresents the name of theloggerused for creating the event; usually it is the name of the class where event was createdNewLinerepresents a new line to split event data on several linesMessagerepresents the event dataExceptionrepresents a logged exception (which includes its stack trace)- Though not used, there is another very important placeholder,
Properties, which contains, obviously, all properties associated with the event
- The
Seqsink usesserverUrlto point to the running Seq instance which will ingest events; my pet project runs Seq via Docker Compose, thus explaining why the host is the local one
- The
- The
Consolesink is used to quickly spot any errors which might occur while performing local dev testing -
Several sinks might need extra setup outside the application configuration files - e.g. the instrumentation key used by Azure Application Insights is set inside Startup class:
private void ConfigureApplicationInsights(IServiceCollection services)
{
    if (IsSerilogApplicationInsightsSinkConfigured)
    {
        var applicationInsightsOptions = new ApplicationInsightsOptions();
        Configuration.Bind(applicationInsightsOptions);

        services.AddApplicationInsightsTelemetry(applicationInsightsOptions.InstrumentationKey);
    }
}
Serilog enrichers
A Serilog enricher is used to add additional properties (enrichment) to each event generated via Serilog.
Check this wiki page for more details about pre-built enrichers.
The community has provided many other enrichers, like: Serilog.Enrichers.AssemblyName (enriches events with assembly related info) or Serilog.Enrichers.OpenTracing (enriches events with OpenTracing context). There are many more enrichers, as one can see by querying GitHub.
My pet project uses Serilog.Enrichers.Thread in order to ensure that the thread ID managed by .NET platform is made available to each application event; this enricher enables better understanding of the application when a particular user action is handled via more than just one thread.
Here’s a fragment found inside appsettings.json file configuring Serilog enrichment:
 "Serilog": {
   ...
   "Enrich": [
      "FromLogContext",
      "WithThreadId"
   ],
    ...
 }
There are several important things worth mentioning:
- We usually need to install one NuGet package per enricher, so just declaring them under the
Enrichsection is not enough - Each enricher has its own list of string values which must be declared under the
Enrichsection, but usually the GitHub repo of each Serilog enricher states what they are, so it shouldn’t be that hard to properly set it up
Serilog properties
Serilog properties are used to provide additional information to each or particular events, thus providing more value to the person querying such data. Each token found in a message template will be made available by Serilog as a property which can be used in a query running inside Seq or any other service capable of handling structured events.
My pet project uses properties to enrich events with information about the name of the application which changes based on the current hosting environment (e.g. local, Azure or anything else) and to provide default values to properties which will be populated at run-time only (e.g. the name of the application flow initiated by a user, the ID of the thread used for running the current code or the ID of the conversation used for grouping related events).
Here’s a fragment found inside appsettings.json file configuring Serilog properties when application runs in any environment:
"Serilog": {
  ...
  "Properties": {
    "Application": "Todo.WebApi",
    "ApplicationFlowName": "N/A",
    "ConversationId": "N/A",
    "ThreadId": "N/A"
  },
  ...
}
Here’s the properties found inside appsettings.Development.json used when application runs locally:
"Serilog": {
  ...
  "Properties": {
    "Application": "Todo.WebApi.Development"
  },
  ...
}
There are several important things worth mentioning:
- The
N/Avalues will be replaced at run-time by actual meaningful values (via log scopes, as described several sections below, to avoid coupling application code with Serilog API), e.g.ApplicationFlowNameproperty will be populated with values like:TodoItem/Add,TodoItems/FetchByQueryorSecurity/GenerateJwt, based on what user action took place at a particular moment of time - All of the properties above act as global ones, since they will accompany any event
- Due to the built-in configuration override mechanism provided by ASP.NET Core, when application runs in any environment, each event will be accompanied by
Application,ApplicationFlowName,ConversationIdandThreadIdproperties, but the value of theApplicationproperty will be set toTodo.WebApiwhen application runs in production environment and will be set toTodo.WebApi.Developmentwhen application runs in development environment.
Serilog stringification
Stringification means invoking the ToString method of an object used as part of an event; Serilog offers the $ stringification operator for this purpose, as seen below:
var unknown = new[] { 1, 2, 3 }
Log.Information("Received {$Data}", unknown);
This will render:
Received "System.Int32[]"
Though my pet project is not using this operator (yet), I believe it might be useful in some scenarios, thus it’s worth mentioning it.
Serilog destructuring
Destructuring means extracting pieces of information from an object like a DTO or POCO and create properties with values.
Using destructuring operator
Serilog offers the @ destructuring operator.
For instance, my pet project uses this operator in order to log the search criteria used for fetching a list of records from a PostgreSQL database via an Entity Framework Core query.
Here’s a fragment found inside TodoService class:
...
private async Task<IList<TodoItemInfo>> InternalGetByQueryAsync(TodoItemQuery todoItemQuery)
{
    logger.LogInformation("About to fetch items using query {@TodoItemQuery} ...", todoItemQuery);
    ...
}
...
Using destructuring policies
In case there is a need to customize the way events are serialized, one can define several destructuring policies, like this:
...
"Destructure": [
  {
    "Name": "With",
    "Args": {
      "policy": "Todo.Integrations.Serilog.Destructuring.DeleteTodoItemInfoDestructuringPolicy, Todo.Integrations.Serilog"
    }
  },
  {
    "Name": "With",
    "Args": {
      "policy": "Todo.Integrations.Serilog.Destructuring.NewTodoItemInfoDestructuringPolicy, Todo.Integrations.Serilog"
    }
  },
  ...
],
...
This is how the DeleteTodoItemInfoDestructuringPolicy class looks like:
public class DeleteTodoItemInfoDestructuringPolicy : IDestructuringPolicy
{
  public bool TryDestructure(object value, ILogEventPropertyValueFactory propertyValueFactory,
      out LogEventPropertyValue result)
  {
    result = null;
    DeleteTodoItemInfo deleteTodoItemInfo = value as DeleteTodoItemInfo;

    if (deleteTodoItemInfo == null)
    {
        return false;
    }

    result = new StructureValue(new List<LogEventProperty>
    {
        new LogEventProperty(nameof(deleteTodoItemInfo.Id), new ScalarValue(deleteTodoItemInfo.Id)),
        new LogEventProperty(nameof(deleteTodoItemInfo.Owner),
            new ScalarValue(deleteTodoItemInfo.Owner.GetNameOrDefault()))
    });

    return true;
  }
}
Using destructuring libraries
In case destructuring operator and policies are not good enough, one can use libraries provided by community, like:
- Destructurama.Attributed which uses attributes to customize event serialization
- Destructurama.ByIgnoring which enables excluding individual properties from events (e.g. log an event representing a user, but exclude any sensitive data, like its
Passwordproperty) - Destructurama.JsonNet which enables handling JSON.NET dynamic types as like any other event
Configure Serilog
In order for an ASP.NET Core application to use Serilog, several things need to be setup:
- Configure the sinks, enrichers and any other Serilog related nouns
- Configure application to use Serilog as a logging provider
Configure Serilog nouns
Up until now I have shown the configuration file based way of setting up Serilog, but this library supports code based configuration too. From what I’ve seen until now, almost each GitHub repo hosting anything related to Serilog (e.g. sink, enricher, etc.), usually documents both approaches. I personally favor setting up Serilog via configuration files since I do not want to redeploy the application each time I need to adjust Serilog setup (i.e. when I need to increase or decrease the current logging level to capture less or more events).
Read more about the different ways of configuring Serilog here, here and here.
In case you have to run your application on top of .NET Framework, check this wiki page to understand how to configure Serilog via the appSettings XML section found inside the application configuration file.
The Serilog JSON configuration of my pet project found inside the appsettings.json can be seen here; each hosting environment overrides various parts of Serilog configuration, usually the logging level, sinks and global properties, as one can see inside appsettings.Development.json, appsettings.IntegrationTests.json and appsettings.DemoInAzure.json files.
There are several important things worth mentioning:
- The
LevelSwitchessection defines a switch used for controlling the current logging level used by Serilog - see more details here- IMPORTANT: This switch can be used for reconfiguring Serilog without the need to restart the application - see more details here
- The
MinimumLevelsection defines what gets logged and what not - e.g.{ "Override": { "Microsoft": "Warning"} }means that from all events generated by classes found under the Microsoft namespace and any of its descendants, Serilog will log only warnings and errors, discarding the rest;{ "Override": { "Microsoft.EntityFrameworkCore.Database.Command": "Information"} }means Serilog will log all SQL commands executed by Entity Framework Core - The
Usingsection declares all Serilog sinks to be used by the application - The
WriteTosection configures each Serilog sink declared inside theUsingsection - The
Enrichsection declares all Serilog enrichers to be used by the application - The
Propertiessection declares all Serilog properties which will accompany all application events - The
Destructuresection declares all Serilog classes used for serializing particular application events
Configure Serilog as an ASP.NET Core logging provider
Until now I have shown how to configure Serilog nouns, now’s the time to show how to add Serilog as a logging provider to an ASP.NET Core application.
The usual approach is to setup things up in two places:
-
Program class, in order to capture any errors occurring during host setup phase
I first need to instantiate Serilog
Loggerclass:private static readonly Logger logger = new LoggerConfiguration() .Enrich.FromLogContext() .WriteTo.Console() .CreateLogger();Then Serilog will be able to log any error:
public static void Main(string[] args) { try { CreateHostBuilder(args).Build().Run(); } catch (Exception exception) { logger.Fatal(exception, "Todo ASP.NET Core Web API failed to start"); throw; } finally { logger.Dispose(); } } -
Startup class, in order to let infrastructure know that it can use Serilog as a logging provider:
services.AddLogging(loggingBuilder =>
{
    if (IsSerilogFileSinkConfigured)
    {
        string logsHomeDirectoryPath = Environment.GetEnvironmentVariable(LogsHomeEnvironmentVariable);

        if (string.IsNullOrWhiteSpace(logsHomeDirectoryPath) || !Directory.Exists(logsHomeDirectoryPath))
        {
            var currentWorkingDirectory = new DirectoryInfo(Directory.GetCurrentDirectory());
            DirectoryInfo logsHomeDirectory = currentWorkingDirectory.CreateSubdirectory("Logs");
            Environment.SetEnvironmentVariable(LogsHomeEnvironmentVariable, logsHomeDirectory.FullName);
        }
    }

    if (!WebHostingEnvironment.IsDevelopment())
    {
        loggingBuilder.ClearProviders();
    }

    loggingBuilder.AddSerilog(new LoggerConfiguration()
        .ReadFrom.Configuration(Configuration)
        .CreateLogger(), dispose: true);
});
There are several important things worth mentioning:
- In case the current environment has been configured to use
Serilog.Sinks.Filesink, then I will ensure the environment variable%LOGS_HOME%declared under the appropriateArgssection will be correctly populated at run-time, so that the log files can be correctly located in that given location (i.e. the Logs directory found under the current working directory) - Any built-in logging providers are removed when application runs outside local development environment to minimize the impact logging has over the application performance
- I’m configuring Serilog via the current application configuration
- There is a downside to my current approach, as the Serilog setup found in Program.cs file differs from the one found in Startup.cs file; on the other hand, Nicholas Blumhardt has come up with a solution and I’m itching for experimenting with it as I’m not happy having to maintain two Serilog configurations
- I had to add several Serilog related NuGet packages:
- Serilog used for creating destructuring policies
- Serilog.AspNetCore used for adding Serilog as logging provider to the ASP.NET Core application
- Serilog.Enrichers.Thread used for enriching events with the current thread ID
- Serilog.Sinks.ApplicationInsights used when sending events to an Azure Application Insights instance
- Serilog.Sinks.Seq used for sending events to a Seq instance
- In case the current environment has been configured to use
What is Seq?
Being able to create events with a given structure is not enough when you need to extract relevant data out of them - one needs the means to parse, index and query such data.
Seq is machine data, for humans (as stated on its home page) and it’s very well equipped to perform these things.
One of the nice things about Seq is that you can freely use it for both development and production, as long as you’re the only user. If you need more users to access your Seq server, you have to start paying - check pricing here.
Run Seq using Docker
The quickest way of running Seq locally is via Docker. Since my pet project uses PostgreSQL too, it felt naturally to run all application dependencies using Docker Compose. The instructions found on Docker Hub are pretty easy to follow and adapting them to Docker Compose is not hard:
version: '3.8'
services:
  ...
  seq:
      container_name: seq
      image: datalust/seq:2021.2
      restart: unless-stopped
      volumes:
        - seq_data:/data
      ports:
        # Ingestion port
        - "5341:5341/tcp"
        # UI port
        - "8888:80/tcp"
      networks:
        - local_seq
      environment:
        - ACCEPT_EULA=Y
volumes:
  ...
  seq_data:
    external: true

networks:
  ...
  local_seq:
There are several important things worth mentioning:
- The ingestion port exposed by Docker to localhost as 5341 matches the port used by
Seqsink (remember"serverUrl": "http://localhost:5341"?) -
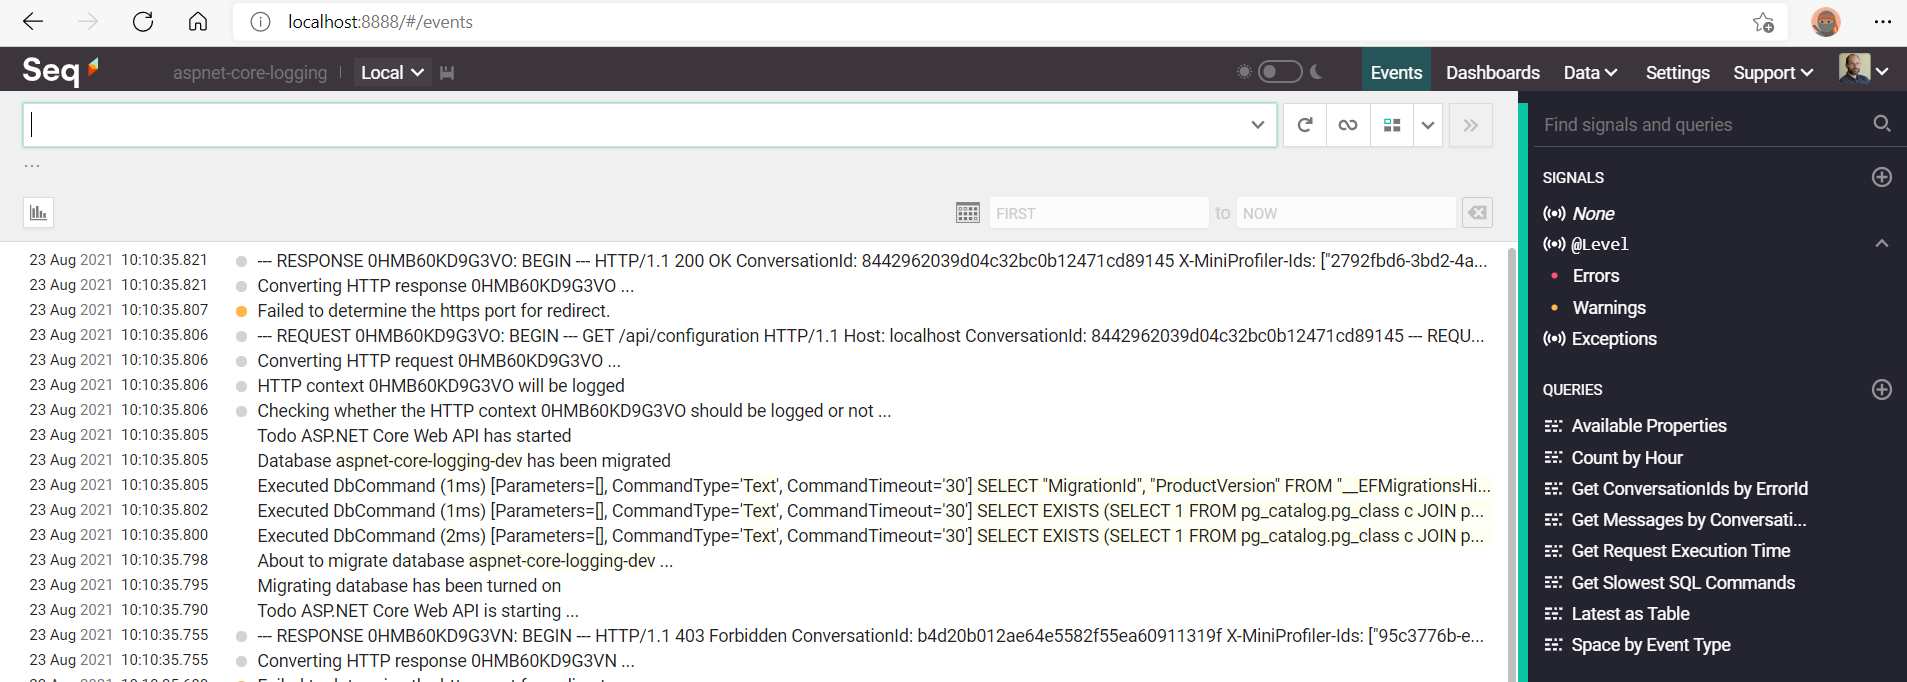
Once Seq Docker container has started, one can access its UI by opening a browser and navigating to URL: http://localhost:8888/#/events, as seen below:
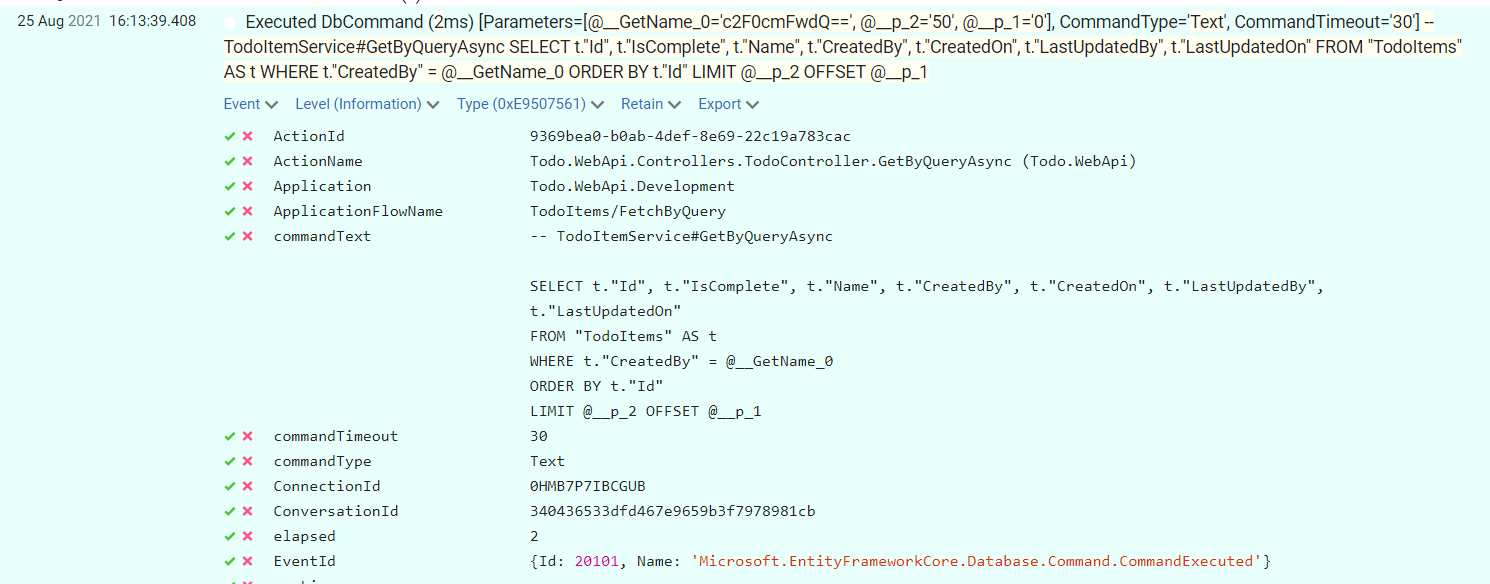
- As soon as Seq has started ingesting events, one can expand them in order to see all relevant details:
Crash course for querying Seq data
Seq uses a SQL-like query language for querying ingested events which is very well documented; due to its sheer complexity, it cannot be the topic of just one post, so I will only show several examples and let the reader consult the official documentation.
Another reason for not writing more about Seq is that you might decide to use a different server for querying structured events, like Azure Monitor and its component Application Insights, so any Seq related info will not help you at all.
-
Given a user, what application flows did he executed during the past 24 hours?
select distinct(ApplicationFlowName) as FlowName
from stream
where
  @Timestamp >= Now() - 24h
  and FlowInitiator = 'c2F0cmFwdQ=='
  and @MessageTemplate like '% has finished executing application flow %'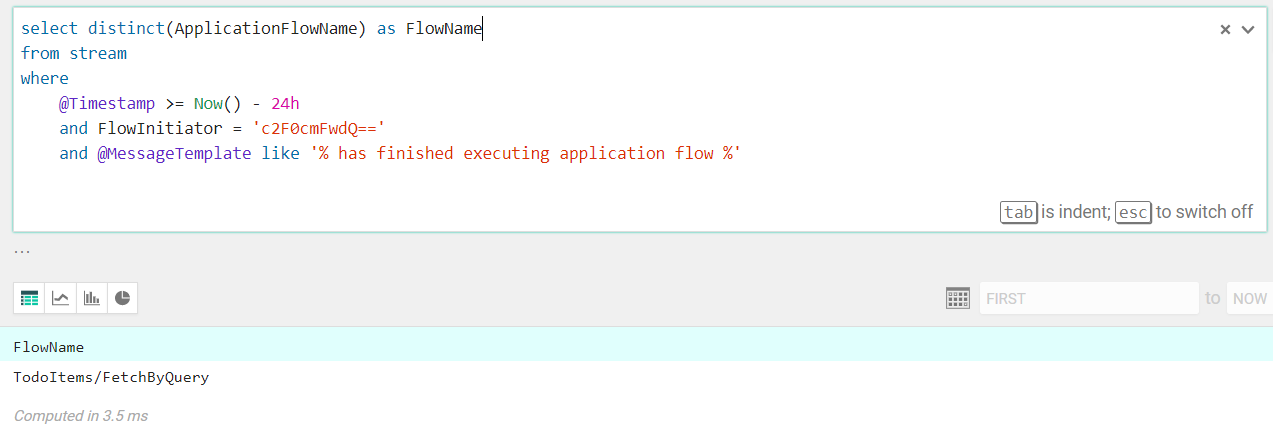
The
ApplicationFlowName(the name of the application flow which implements a business feature) andFlowInitiator(the obfuscated name of the current user who initiated the flow) are custom Serilog properties populated at run-time via log scopes, while@MessageTemplateand@Timestampare built-in properties provided by Seq.
Thefrom streamclause says that events will be extracted from the ingested ones. -
What kind of messages are logged by this application?
select distinct(@MessageTemplate) as MessageTemplate
from stream
where
  @MessageTemplate not like '--- REQUEST %'
  and @MessageTemplate not like '--- RESPONSE %'
order by MessageTemplate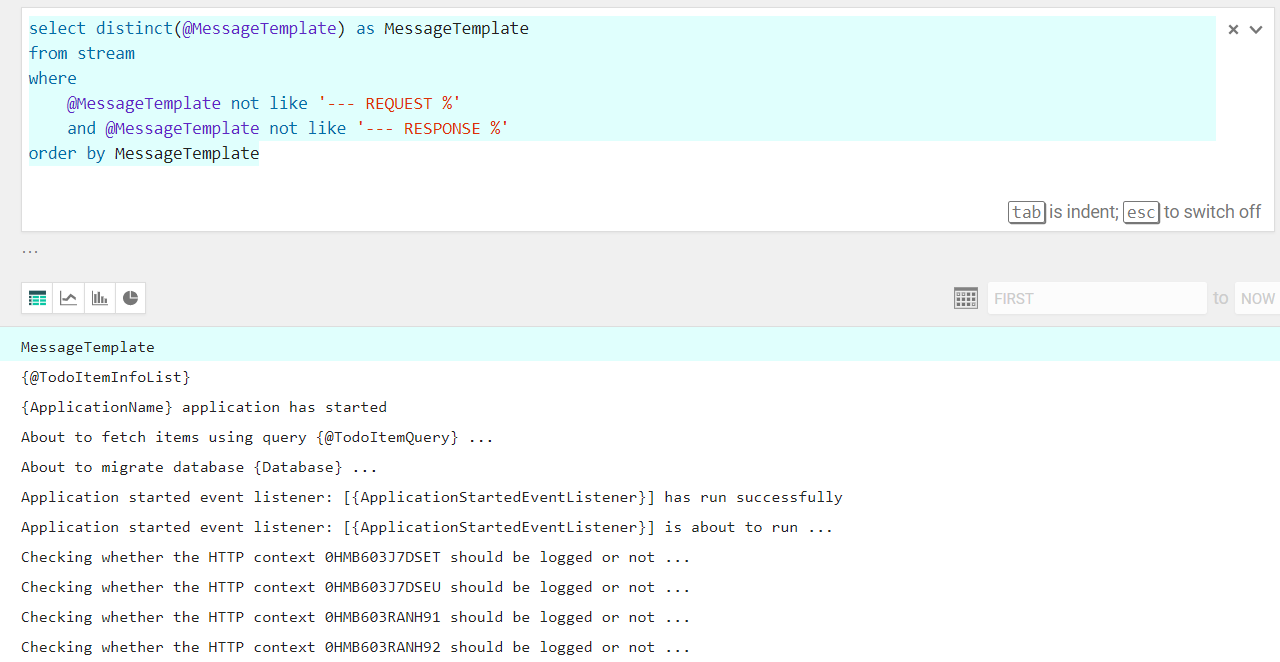
The
@MessageTemplateproperty represents the template used by the application to create an event and sent to Seq via a Serilog sink; looking at each such template, one can understand what is being logged and whether this pose any security risk or not. For instance, a security auditor might check each template to understand whether any sensitive data (e.g. passwords, authentication tokens, etc.) is being logged. If this is the case, the developer will need to patch the code and redeploy the new application version, thus fixing the security issue. Having to manually read the entire code base to figure out whether application logs sensitive data is a very tedious and error prone process, so using a Seq query instead is the better approach.
Log application events
An ASP.NET Core application logs events using Microsoft.Extensions.Logging.ILogger interface provided via Microsoft.Extensions.Logging.Abstractions NuGet package.
Any class which needs to log events will require infrastructure to inject an ILogger object and will use any of its LogXYZ overloads to create and send the event to the underlying logging provider, i.e. Serilog.
public class TodoItemService : ITodoItemService
{
  ...
  private readonly ILogger logger;

  public TodoItemService(TodoDbContext todoDbContext, ILogger<TodoItemService> logger)
  {
      ...
      this.logger = logger ?? throw new ArgumentNullException(nameof(logger));
  }

  private async Task<IList<TodoItemInfo>> InternalGetByQueryAsync(TodoItemQuery todoItemQuery)
  {
      logger.LogInformation("About to fetch items using query {@TodoItemQuery} ...", todoItemQuery);
      ...
  }
  ...
}
Logging providers
I’ve already mentioned Serilog as an ASP.NET Core logging provider. Microsoft offers several built-in logging providers, but there are plenty 3rd parties as well.
In case you have invested in a specific logging framework, like Log4Net or NLog, the good news is you’ll most likely be able to use it, as community most likely has provided an integration with ASP.NET Core.
If such integration is missing, it’s a good opportunity for a developer to make a name for himself ;)!
Message templates
The Microsoft.Extensions.Logging.ILogger interface comes with several LogXYZ overloads where message parameter is always a string. When I initially started using this interface, before starting using structured logging, I used string interpolation believing that the message is the actual info to be logged, so my logging code would look like this:
var user = service.GetUser(...);
var action = service.GetAction(...);
logger.LogInformation($"User with name {user.UserName} has initiated action {action.Name}");
The Log4Net based logging provider I was using at that time would happily write the above string inside the currently configured console or file, but that was an unstructured way of logging.
The structured way means treating message as a message template and not as a plain string. The logging provider knows how to create the event based on this template, but will also have the chance of promoting the actual values used for replacing the placeholders to properties which have specific semantics, thus being able to handle a structured event.
Considering all of the above, the correct way of logging structured events in ASP.NET Core is:
var user = service.GetUser(...);
var action = service.GetAction(...);
logger.LogInformation("User with name {UserName} has initiated action {ActionName}", user.UserName, action.Name);
There are several important things worth mentioning:
- The above code fragment contains:
- A message template:
User with name {UserName} has initiated action {ActionName} - Two placeholders:
{UserName}and{ActionName}- Please note I’m using Pascal case for their names, as they represent properties I will most probably use inside Seq queries
- Two values which will replace the placeholders when the logging provider will handle the event at run-time:
user.UserNameandaction.Name- The order of the values is important, since each placeholder will be replaced with the corresponding value
- A message template:
- We no longer need to use string interpolation
Because I’m employing message templates and since I’m using Seq, I could run the following query in order to identify the users which have logged-in during the last 24 hours:
select
  distinct(UserName)
from stream
where
  @Timestamp >= now() - 24h
  and ActionName = 'Login'
Additionally, I could run a query to identify which users did not login during the past 6 months, and thus I should deactivate their accounts; I could run many other such queries - the only real impediments in getting the most out of the ingested structured events are my imagination and my ability in mastering Seq query language!
Log scopes
What happens if I want to ensure that a particular set of events share the same property? For instance, there is good reason in identifying all events generated while processing a particular HTTP request - what we want is to basically group such events by their HTTP request identifier.
ASP.NET Core provides the so-called log scopes which are used exactly for such grouping purposes.
In order to group events by their HTTP request identifier, one can employ an ASP.NET Core middleware which will generate an identifier (basically a GUID) which will accompany any event created while processing that particular HTTP request.
The below fragment belongs to ConversationIdProviderMiddleware class:
public async Task Invoke(HttpContext httpContext)
{
    if (!httpContext.Request.Headers.TryGetValue(ConversationId, out StringValues conversationId)
        || string.IsNullOrWhiteSpace(conversationId))
    {
        conversationId = Guid.NewGuid().ToString("N");
        httpContext.Request.Headers.Add(ConversationId, conversationId);
    }

    httpContext.Response.Headers.Add(ConversationId, conversationId);

    using (logger.BeginScope(new Dictionary<string, object>
    {
        [ConversationId] = conversationId.ToString()
    }))
    {
        await nextRequestDelegate(httpContext);
    }
}
In the lines above I’m checking whether a ConversationId has already been provided as an HTTP header; if not, I’m creating a new one and adding it to both HTTP request and response.
I’m then creating a log scope to store a dictionary containing the ConversationId key - this will ensure that this key-value pair will accompany all events created during this HTTP operation; I personally believe using key-value pairs make the code more readable than using other ways of setting the scope, but feel free to disagree.
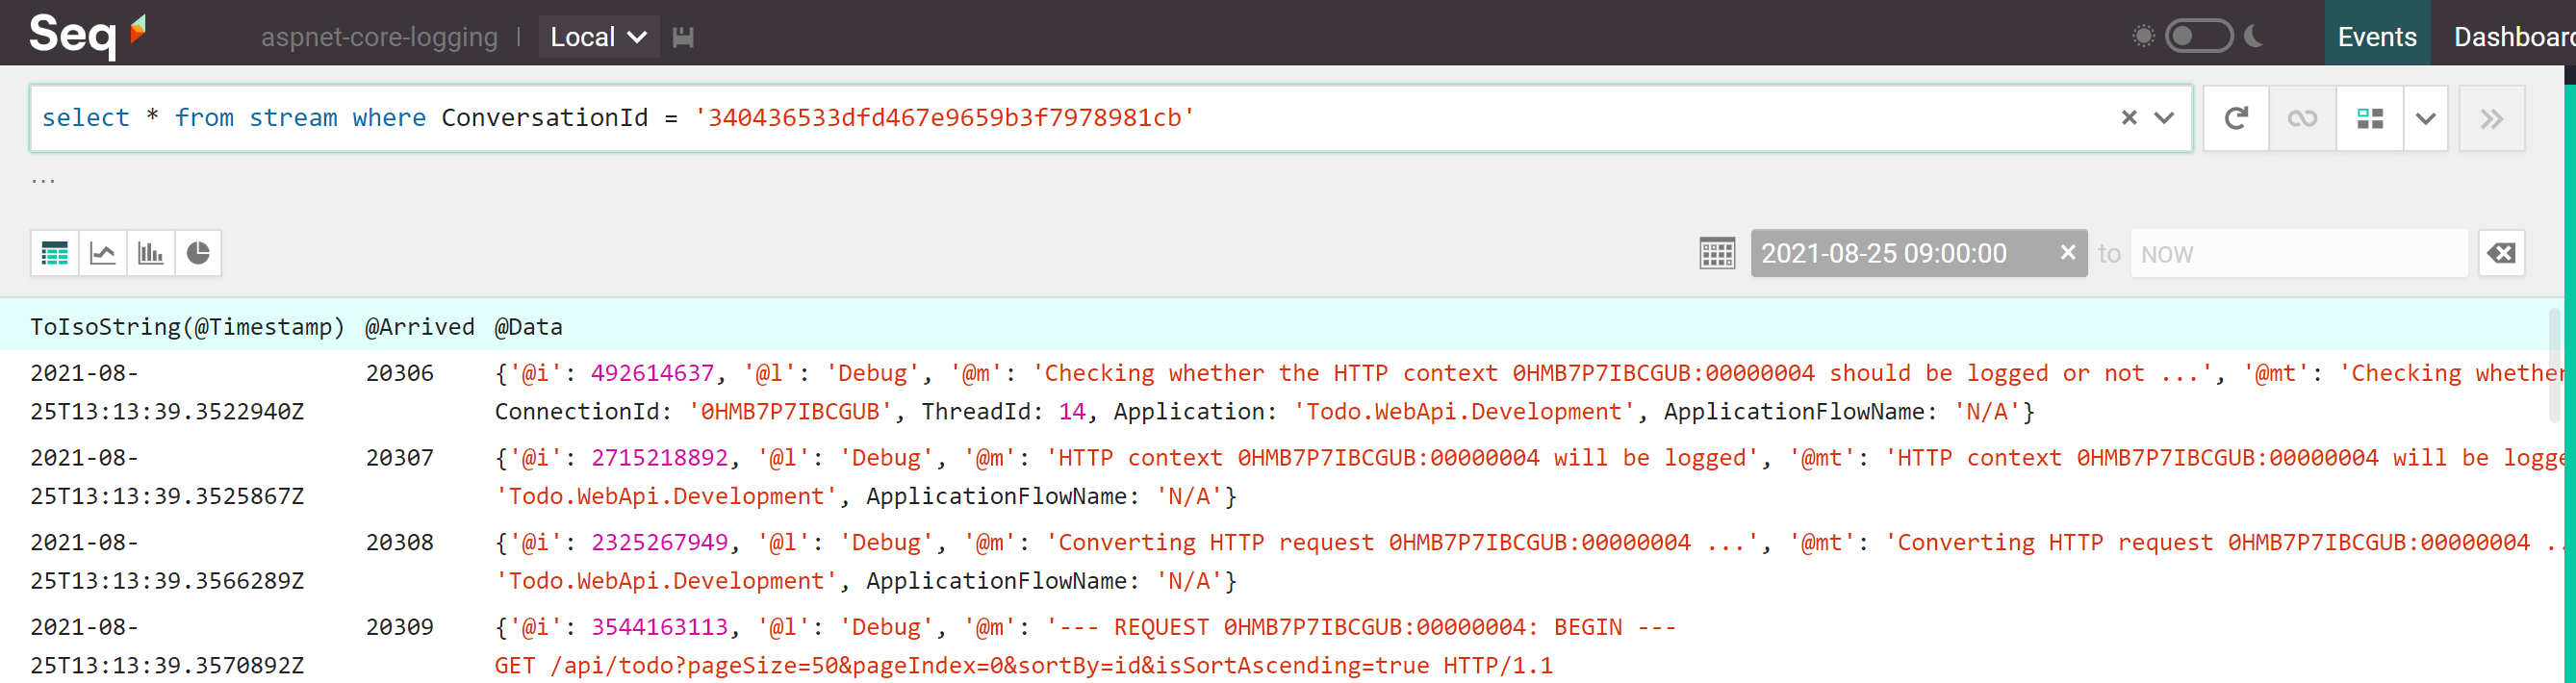
Identifying events belonging to one particular conversation is a matter of running the following Seq query:
select *
from stream
where ConversationId = '340436533dfd467e9659b3f7978981cb'
This query will find several events:
Use cases
Aggregating application events (and not just this kind of events, as one could also collect events generated by the infrastructure used for running this application!) into one place and being able to query them using a structured language is very powerful and can cut costs expressed in reduced issue investigation time, reduced employee & end-user frustration, increased chance of making the best possible business decisions, and more, so much more!
IMPORTANT: I took the liberty of describing several use cases where I personally believe structured logging really shines, but most certainly they are not the only ones!
Debugging
One of the most common purposes we use logging for is debugging; since we usually must not attach a debugger to a production environment to investigate an issue as this will most likely cause worse ones, we have to rely on reading the existing logged events to figure why a particular piece of application behaves the way it does.
Identify error root cause
In case the application throws an exception, we usually log it and display a notification to the end-user saying that an error has occurred while processing his request. We can do better than that: let’s generate an error ID, include it inside the message used for logging the exception and make sure the notification to the end-user mentions it too so that any bug report which will eventually need to be taken care by the developers will include it. It’s way easier to run a query to fetch the exception along with all of its relevant details once you know its associated error ID than it is to manually search through all events logged during the period of time mentioned inside the bug report (usually given by the time when the report was created, though the report might be created at a later time after the bug was spotted).
We need to configure exception handling inside the Startup.Configure method:
public void Configure(IApplicationBuilder applicationBuilder, IHostApplicationLifetime hostApplicationLifetime, ILogger<Startup> logger)
{
    ...
    applicationBuilder.UseExceptionHandler(new ExceptionHandlerOptions
    {
        ExceptionHandler = CustomExceptionHandler.HandleException,
        AllowStatusCode404Response = true
    });
    ...
}
The CustomExceptionHandler.ConvertToProblemDetails method converts the caught exception into a ProblemDetails instance allowing for a consistent error response:
private static ProblemDetails ConvertToProblemDetails(Exception exception, bool includeDetails)
{
    var problemDetails = new ProblemDetails
    {
        Status = (int) GetHttpStatusCode(exception),
        Title = "An unexpected error occurred while trying to process the current request",
        Detail = includeDetails ? exception?.ToString() : string.Empty,
        Extensions =
        {
            {ErrorData, exception?.Data},
            {ErrorId, Guid.NewGuid().ToString("N")},
            {ErrorKey, GetErrorKey(exception)}
        }
    };

    return problemDetails;
}
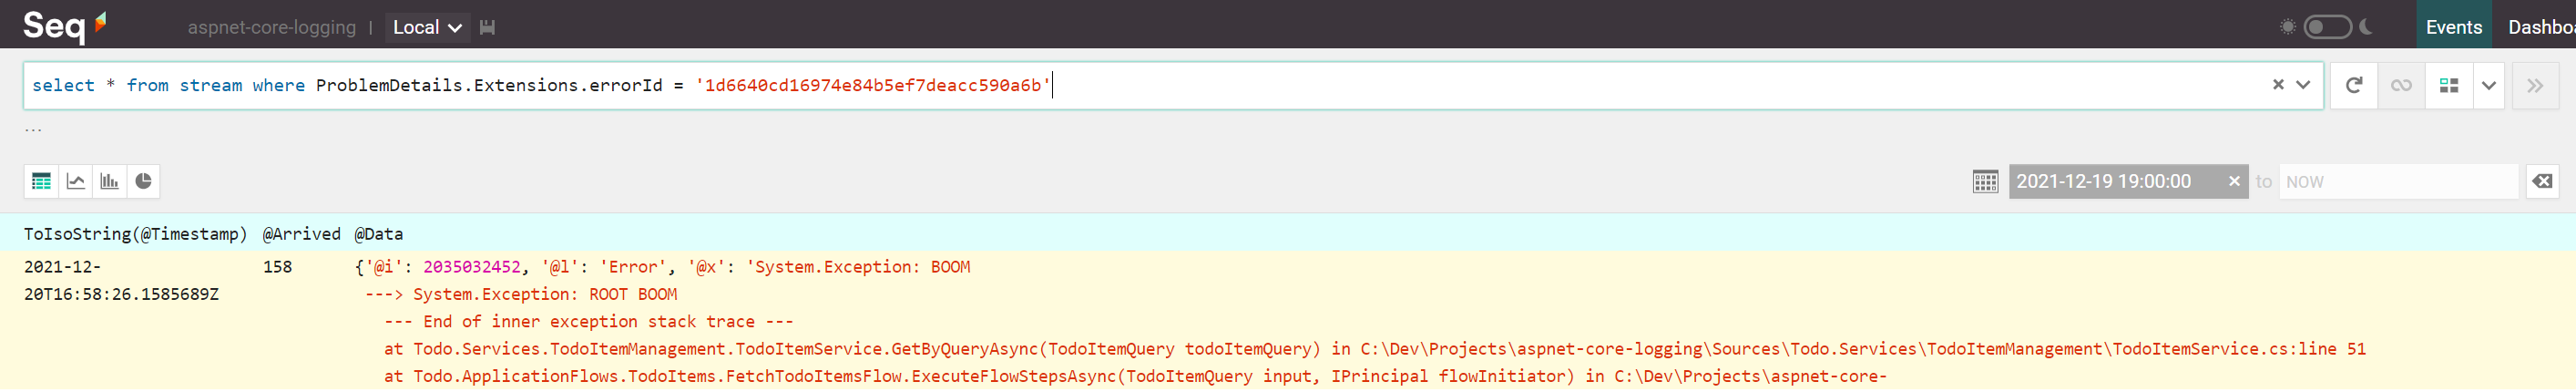
The above ProblemDetails.Extensions dictionary contains an ErrorId key which points to a plain Guid - this is our error ID which will allows us to run a query like below (given its value is 1d6640cd16974e84b5ef7deacc590a6b):
select *
from stream
where ErrorId = '1d6640cd16974e84b5ef7deacc590a6b'
Or you can run the equivalent:
select *
from stream
where ProblemDetails.Extensions.errorId = '1d6640cd16974e84b5ef7deacc590a6b'
This query will find exactly one event:
Fetch events from same conversation
Let’s assume we have received a bug report mentioning the above error ID, 1d6640cd16974e84b5ef7deacc590a6b. We can query Seq to get the exception details, but what happened during that HTTP request until that moment? To answer this question, I will re-use the aforementioned conversation ID concept. ASP.NET Core has built-in support for grouping requests, as documented here; on the other hand, as I’m a rather curious person, I’ve implemented my own middleware to inject the conversation ID via log scope into each event generated during the same conversation, as already seen inside the ConversationIdMiddleware.Invoke method.
Identifying the appropriate conversation ID when we already know the error ID can be done via:
select ConversationId
from stream
where ProblemDetails.Extensions.errorId = '1d6640cd16974e84b5ef7deacc590a6b'
This query will find the conversation ID:

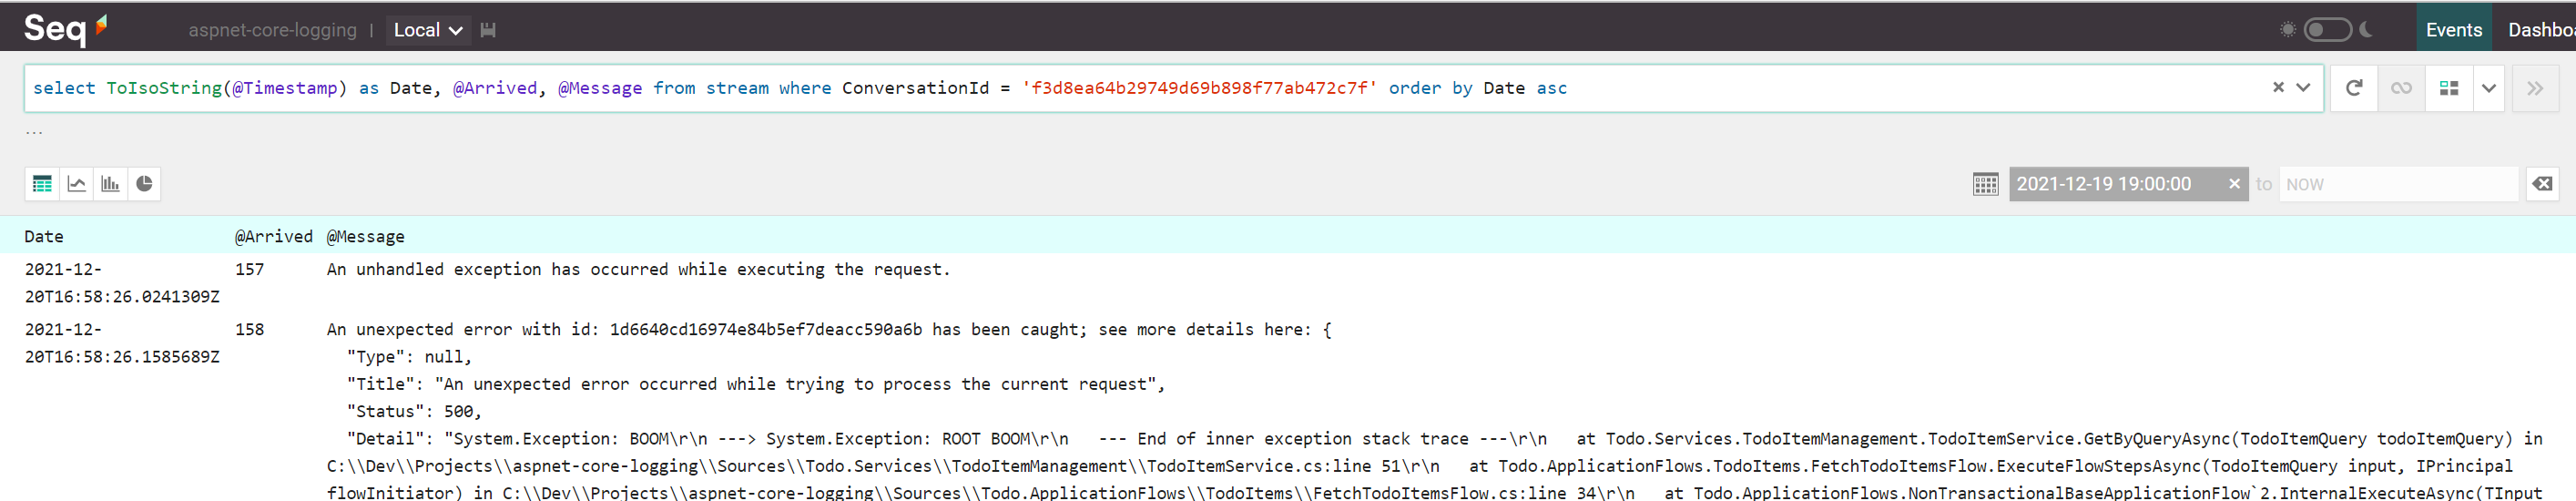
Fetching all events belonging to the conversation where the exception has occurred can be done via:
select ToIsoString(@Timestamp) as Date, @Arrived, @Message
from stream
where ConversationId = 'f3d8ea64b29749d69b898f77ab472c7f'
order by Date asc
The above query projects the Seq built-in property @Timestamp into a new value and will use it to sort entries ascending:
Analytics
When running an application in production, we usually want to understand how its end-users are using it in order to better shape it (e.g., invest most effort into most used features to make them more appealing and more useful, what features to discard as they are not used as much as expected, etc.). Structured logging can be used as a tool to get such data; this does not mean that no other analytics tool should be used, it’s just that employing this one is very easy and it can offer good results without much effort.
Identify most used application features
Since the Todo Web API has been built around the concept of application flows, each processed business-related HTTP request will trigger the execution of a particular flow and its name, outcome and execution time, along with the user triggering it, are logged using log scopes:
public async Task<TOutput> ExecuteAsync(TInput input, IPrincipal flowInitiator)
{
    using (logger.BeginScope(new Dictionary<string, object> { [ApplicationFlowName] = flowName }))
    {
        bool isSuccess = false;
        Stopwatch stopwatch = Stopwatch.StartNew();
        string flowInitiatorName = flowInitiator.GetNameOrDefault();

        try
        {
            logger.LogInformation(
                "User [{FlowInitiator}] has started executing application flow [{ApplicationFlowName}] ...",
                flowInitiatorName, flowName);
            TOutput output = await InternalExecuteAsync(input, flowInitiator);
            isSuccess = true;
            return output;
        }
        finally
        {
            stopwatch.Stop();
            logger.LogInformation(
                "User [{FlowInitiator}] has finished executing application flow [{ApplicationFlowName}] "
                + "with the outcome: [{ApplicationFlowOutcome}]; "
                + "time taken: [{ApplicationFlowDurationAsTimeSpan}] ({ApplicationFlowDurationInMillis}ms)",
                flowInitiatorName, flowName, isSuccess ? "success" : "failure", stopwatch.Elapsed,
                stopwatch.ElapsedMilliseconds);
        }
    }
}
There are several important things worth mentioning regarding the above code fragment:
- {FlowInitiator}: represents the obfuscated name of the user who has triggered the execution of the flow
- {ApplicationFlowName}: pretty obvious
- {ApplicationFlowOutcome}: represents the outcome of the flow: either success or failure
- {ApplicationFlowDurationAsTimeSpan}: a string representation of the time needed to execute the flow
- {ApplicationFlowDurationInMillis}: represents the number of milliseconds spent executing the flow
Since these tokens will be available for later querying in Seq, this means we can see which are the most used application flows, along with their minimum, average and maximum durations, thus allowing business stakeholders prioritize development work; basically, the developers should focus first on reducing the execution time of the most used application flows with the largest average execution durations.
Run the below query to fetch this information:
select
    count(*) as NumberOfCalls
  , min(ApplicationFlowDurationInMillis) as MinDurationInMillis
  , mean(ApplicationFlowDurationInMillis) as AvgDurationInMillis
  , max(ApplicationFlowDurationInMillis) as MaxDurationInMillis
from stream
where @Timestamp >= Now() - 8h
      and ApplicationFlowName <> 'N/A'
group by ApplicationFlowName
having AvgDurationInMillis > 5
order by NumberOfCalls desc
The above query will discard several categories of events:
- Older than 8 hours (
@Timestamp >= Now() - 8h) - Not belonging to a specific business-related application flow (
ApplicationFlowName <> 'N/A') - Have taken, in average, more than 5 milliseconds to execute (
having AvgDurationInMillis > 5)
The query results look something like this:
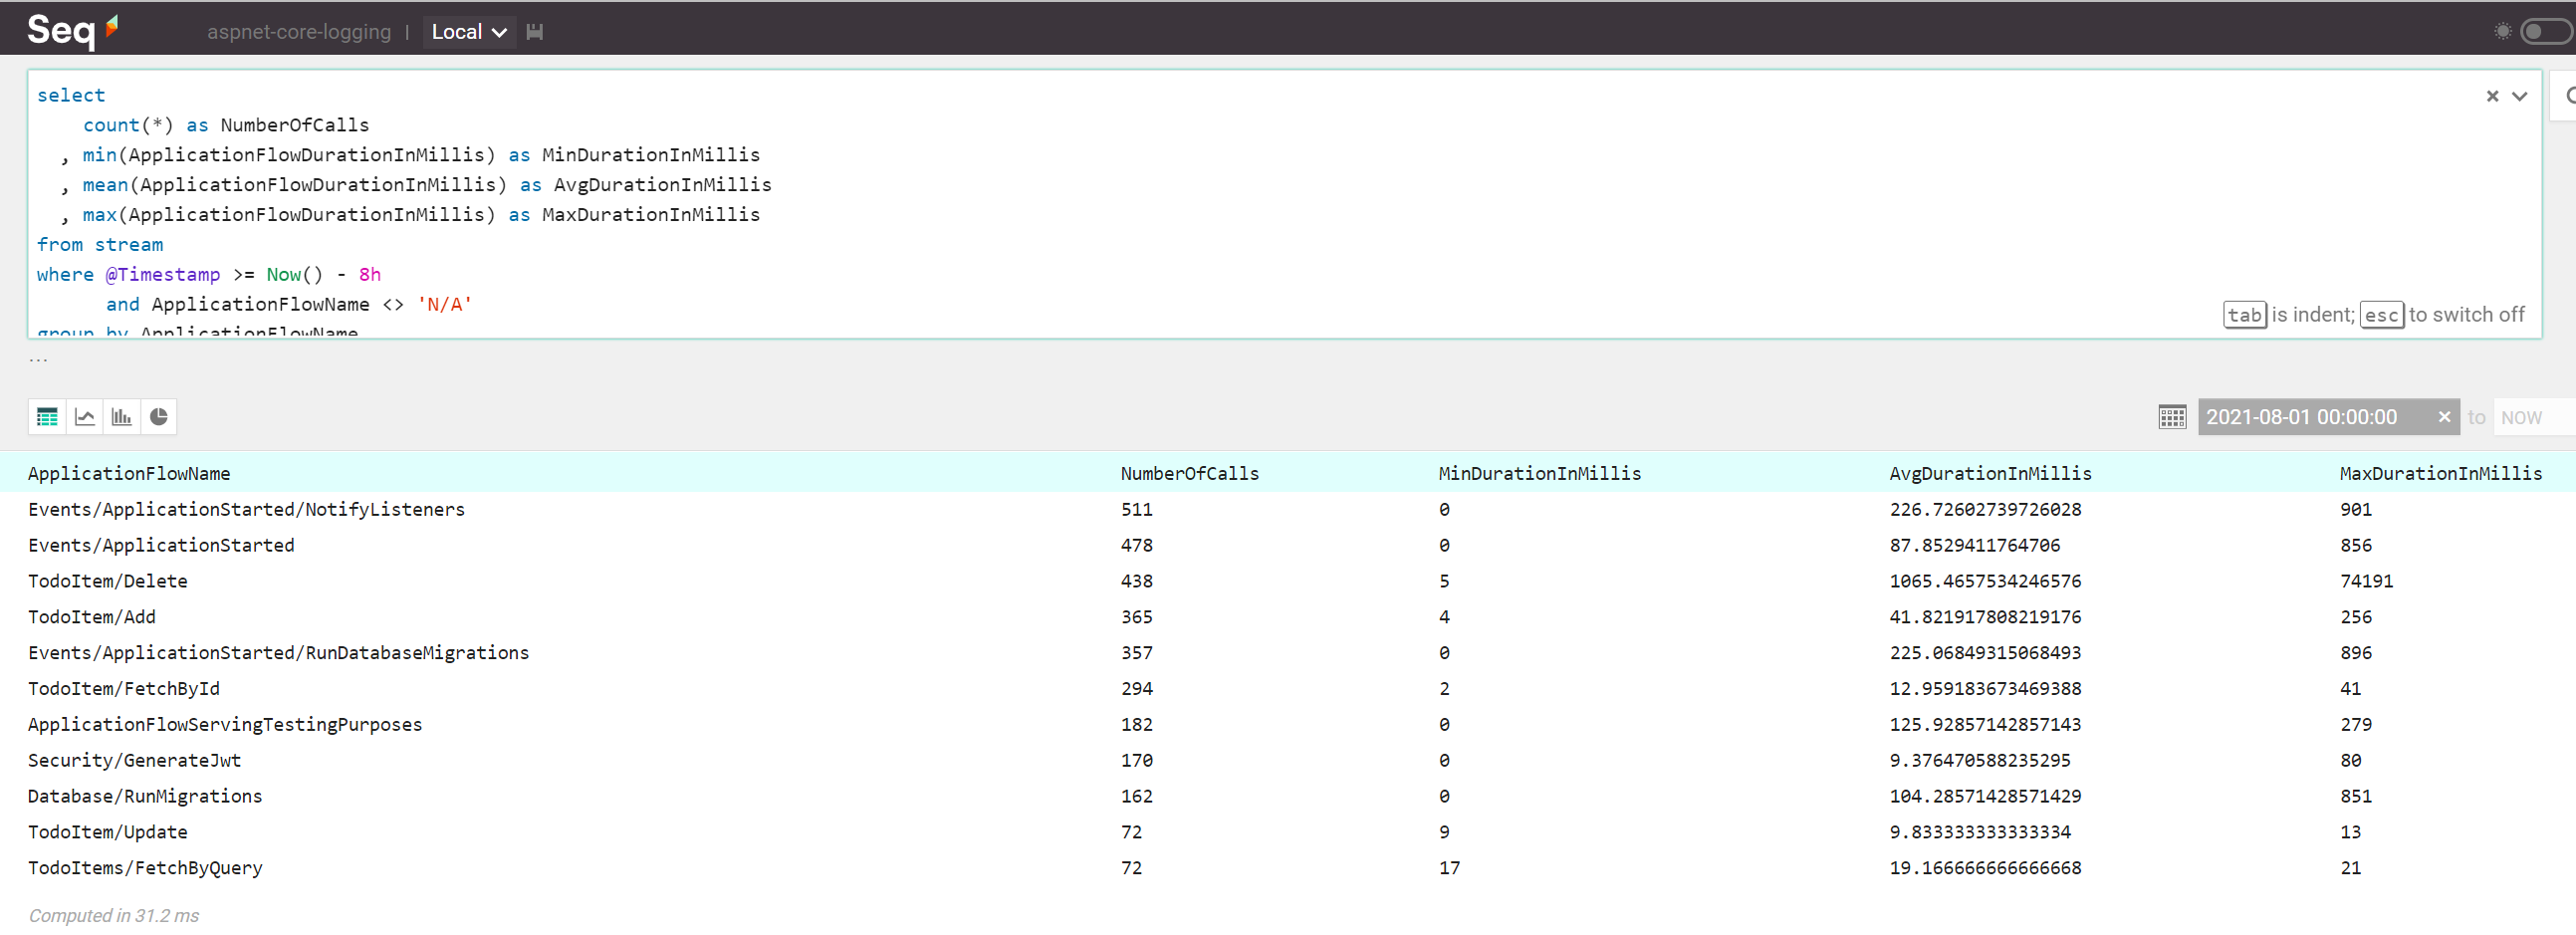
Based on the above data, it seems that developers should start looking into optimizing the Events/ApplicationStarted/NotifyListeners, Events/ApplicationStarted and TodoItem/Delete application flows. Since the first two of them happen when application starts, most likely deleting data should be optimized first!
The bottom line is that structured logging helps making business and technical decisions, as long as the relevant data has been properly logged.
Auditing
Auditing is the process which allows recording user actions performed against particular parts of the application.
Audit user actions
Knowing what user has performed a specific action helps stakeholders in making the right decision about where to invest the most effort when developing and/or maintaining an application.
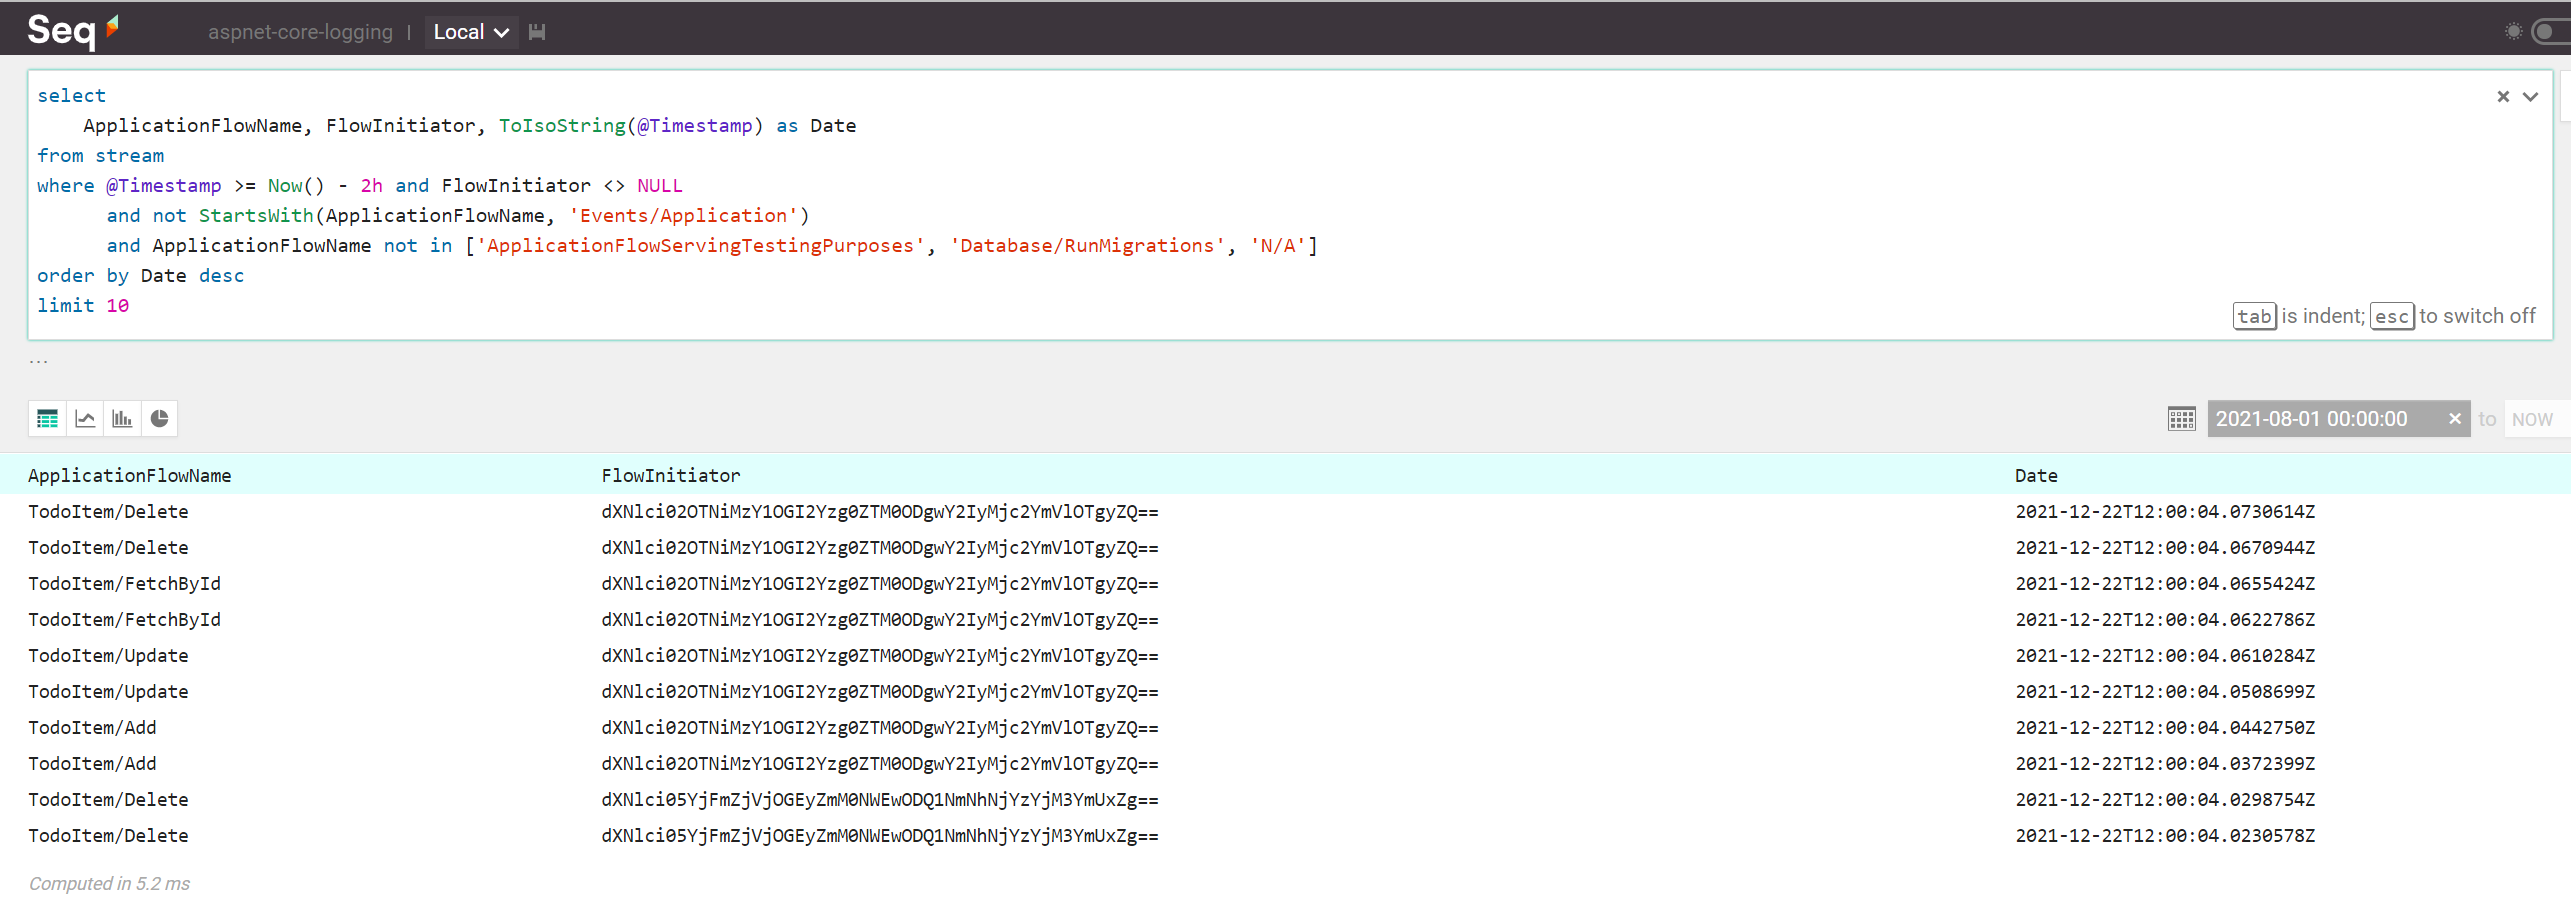
Given that the previously mentioned application flow concept logs both the flow name and its initiator, we can run the below query to understand who has done what and when:
select
      ApplicationFlowName
    , FlowInitiator
    , ToIsoString(@Timestamp) as Date
from stream
where @Timestamp >= Now() - 2h
      and FlowInitiator <> NULL
      and not StartsWith(ApplicationFlowName, 'Events/Application')
      and ApplicationFlowName not in ['ApplicationFlowServingTestingPurposes', 'Database/RunMigrations', 'N/A']
order by Date desc
limit 10
The above query will discard several categories of events:
- Older than 2 hours (
@Timestamp >= Now() - 2h) - Not having a user associated with them (
FlowInitiator <> NULL) - Not having their names starting with
Events/Applicationstring (not StartsWith(ApplicationFlowName, 'Events/Application')) - Not having their names appearing in a given list (
ApplicationFlowName not in ['ApplicationFlowServingTestingPurposes', 'Database/RunMigrations', 'N/A'])
Additionally, the query will fetch the first 10 events matching the given search criteria.
The query results look something like this:
Performance
Being able to know about the hot spots of the application is crucial, since end-users are not happy dealing with an application which responds slowly; the stakeholders cannot be happy with ever-increasing bills for an application which is sub-optimal as it consumes way too much CPU, memory and storage.
You got the point - nobody is happy with an under-performant application; on the other hand, making a performant application needs the initial knowledge about what is not performant and here structured logging can help also, as we can query for events representing the data we care about, like: what operation took the most time to finish, what is the minimum amount of memory used by the application in the last 24 hours, so on and so forth.
Identify slowest SQL queries
I was quite amazed finding out that Entity Framework Core logs the time needed to execute each SQL statement via the elapsed property accompanying the Microsoft.EntityFrameworkCore.Database.Command.CommandExecuted events.
Having this knowledge, I can fetch the slowest top 3 SQL commands executed by this ORM during the past 4 hours via:
select
      @Id as ID
    , commandText as RawSql
    , parameters as Parameters
    , ToNumber(elapsed) as ExecutionTimeInMillis
from stream
where
    @Timestamp >= Now() - 4h
    and EventId.Name = 'Microsoft.EntityFrameworkCore.Database.Command.CommandExecuted'
    and ExecutionTimeInMillis > 5
    and commandText <> NULL
    and commandText NOT LIKE '%FROM pg_catalog%'
    and commandText NOT LIKE '%EFMigrationsHistory%'
order by ExecutionTimeInMillis desc
limit 3
The query results look something like this:
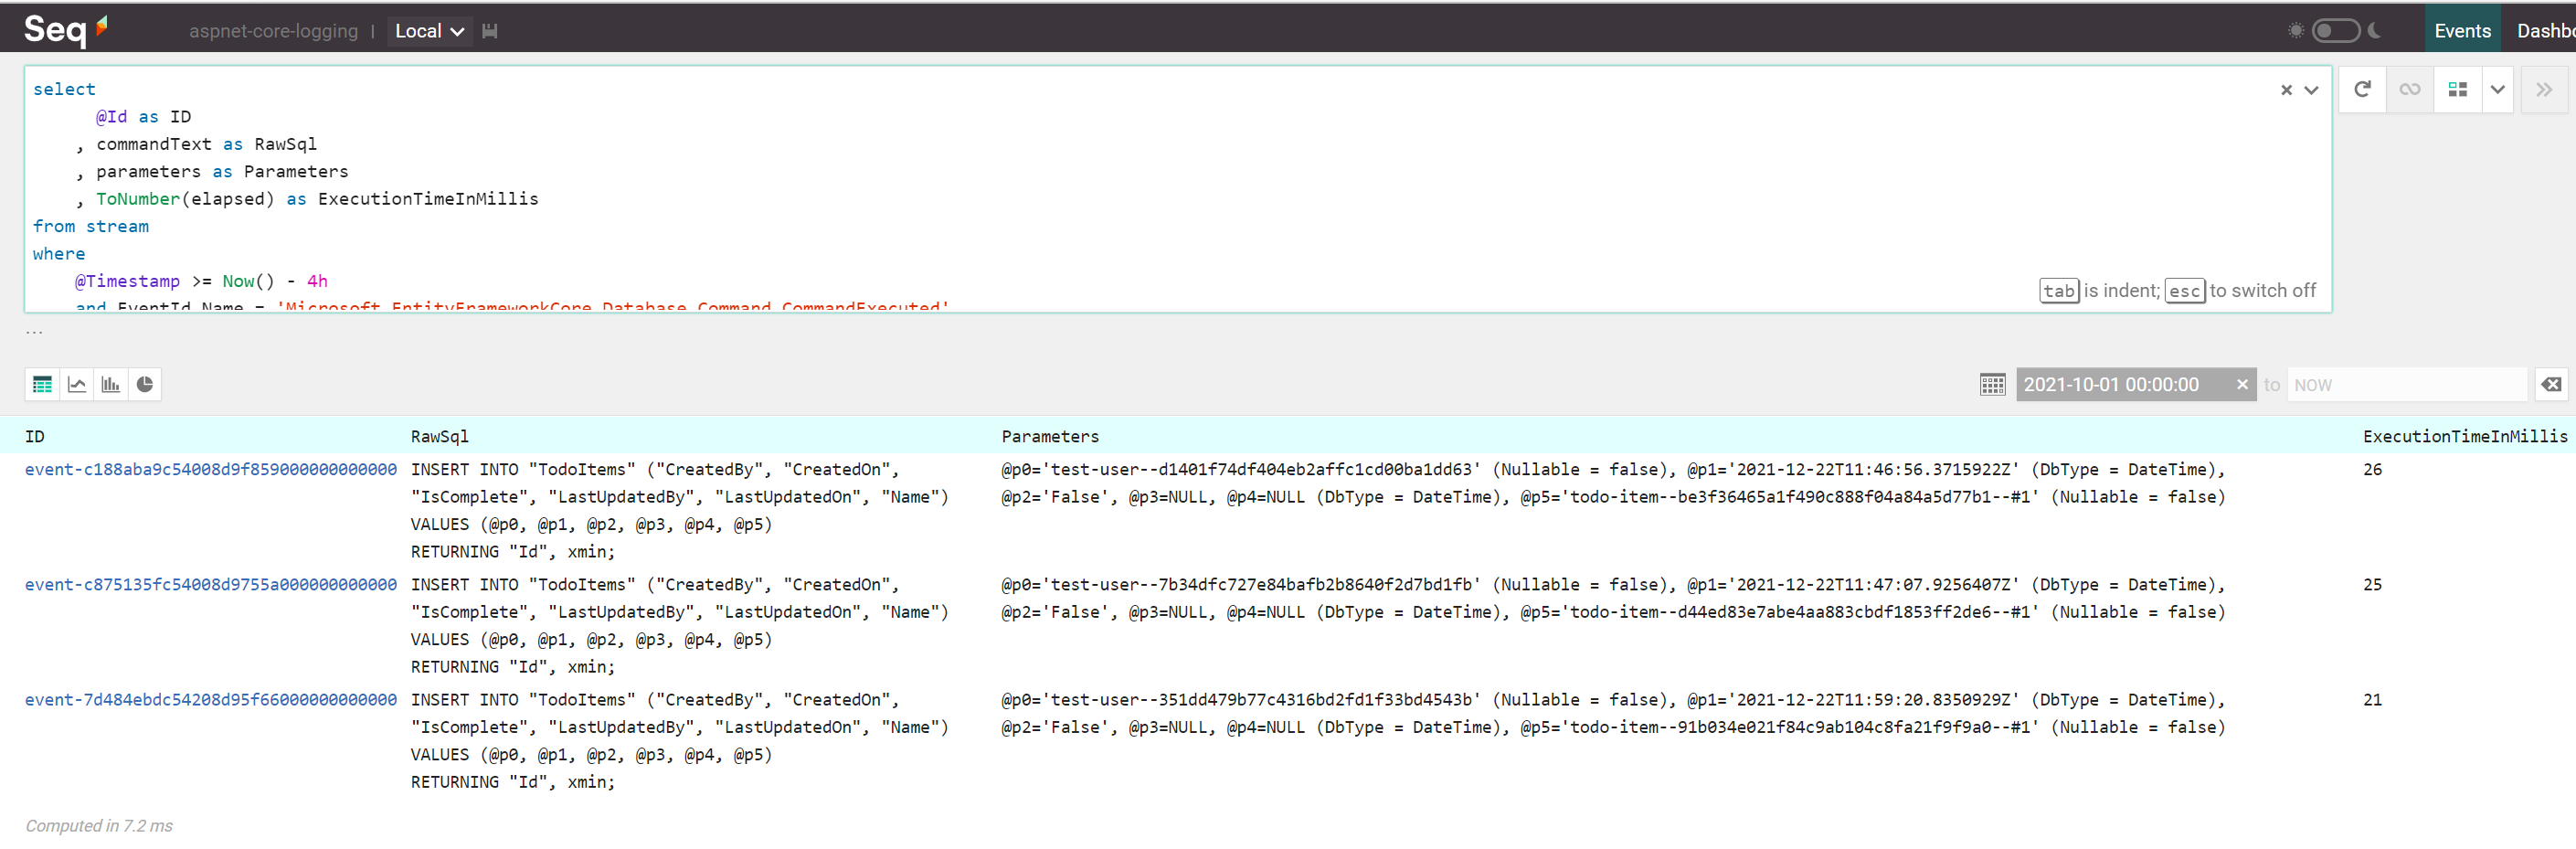
Using the above information, developers with the help of a capable DBA will be able to optimize database access by focusing on the slowest queries. Of course, there are other ways of identifying slow queries (e.g. 3 ways to detect slow queries in PostgreSQL), but since we’re already using structured logging, this is one of the easiest way and will also work with any database supported by Entity Framework Core!
Identify slowest application features
Identifying such features is rather easy since we’re using the same aforementioned application flow concept which logs the time spent with its execution.
We will query the top 3 slowest application flows via:
select *, ToNumber(ApplicationFlowDurationInMillis) as ExecutionTimeInMillis
from stream
where
  @Timestamp >= Now() - 4h
  and Has(ApplicationFlowOutcome)
  and ExecutionTimeInMillis > 250
order by ExecutionTimeInMillis desc
limit 3
The above query will fetch data from the past 4 hours and will ignore flows which took less than 250 milliseconds to complete; the results look something like this:
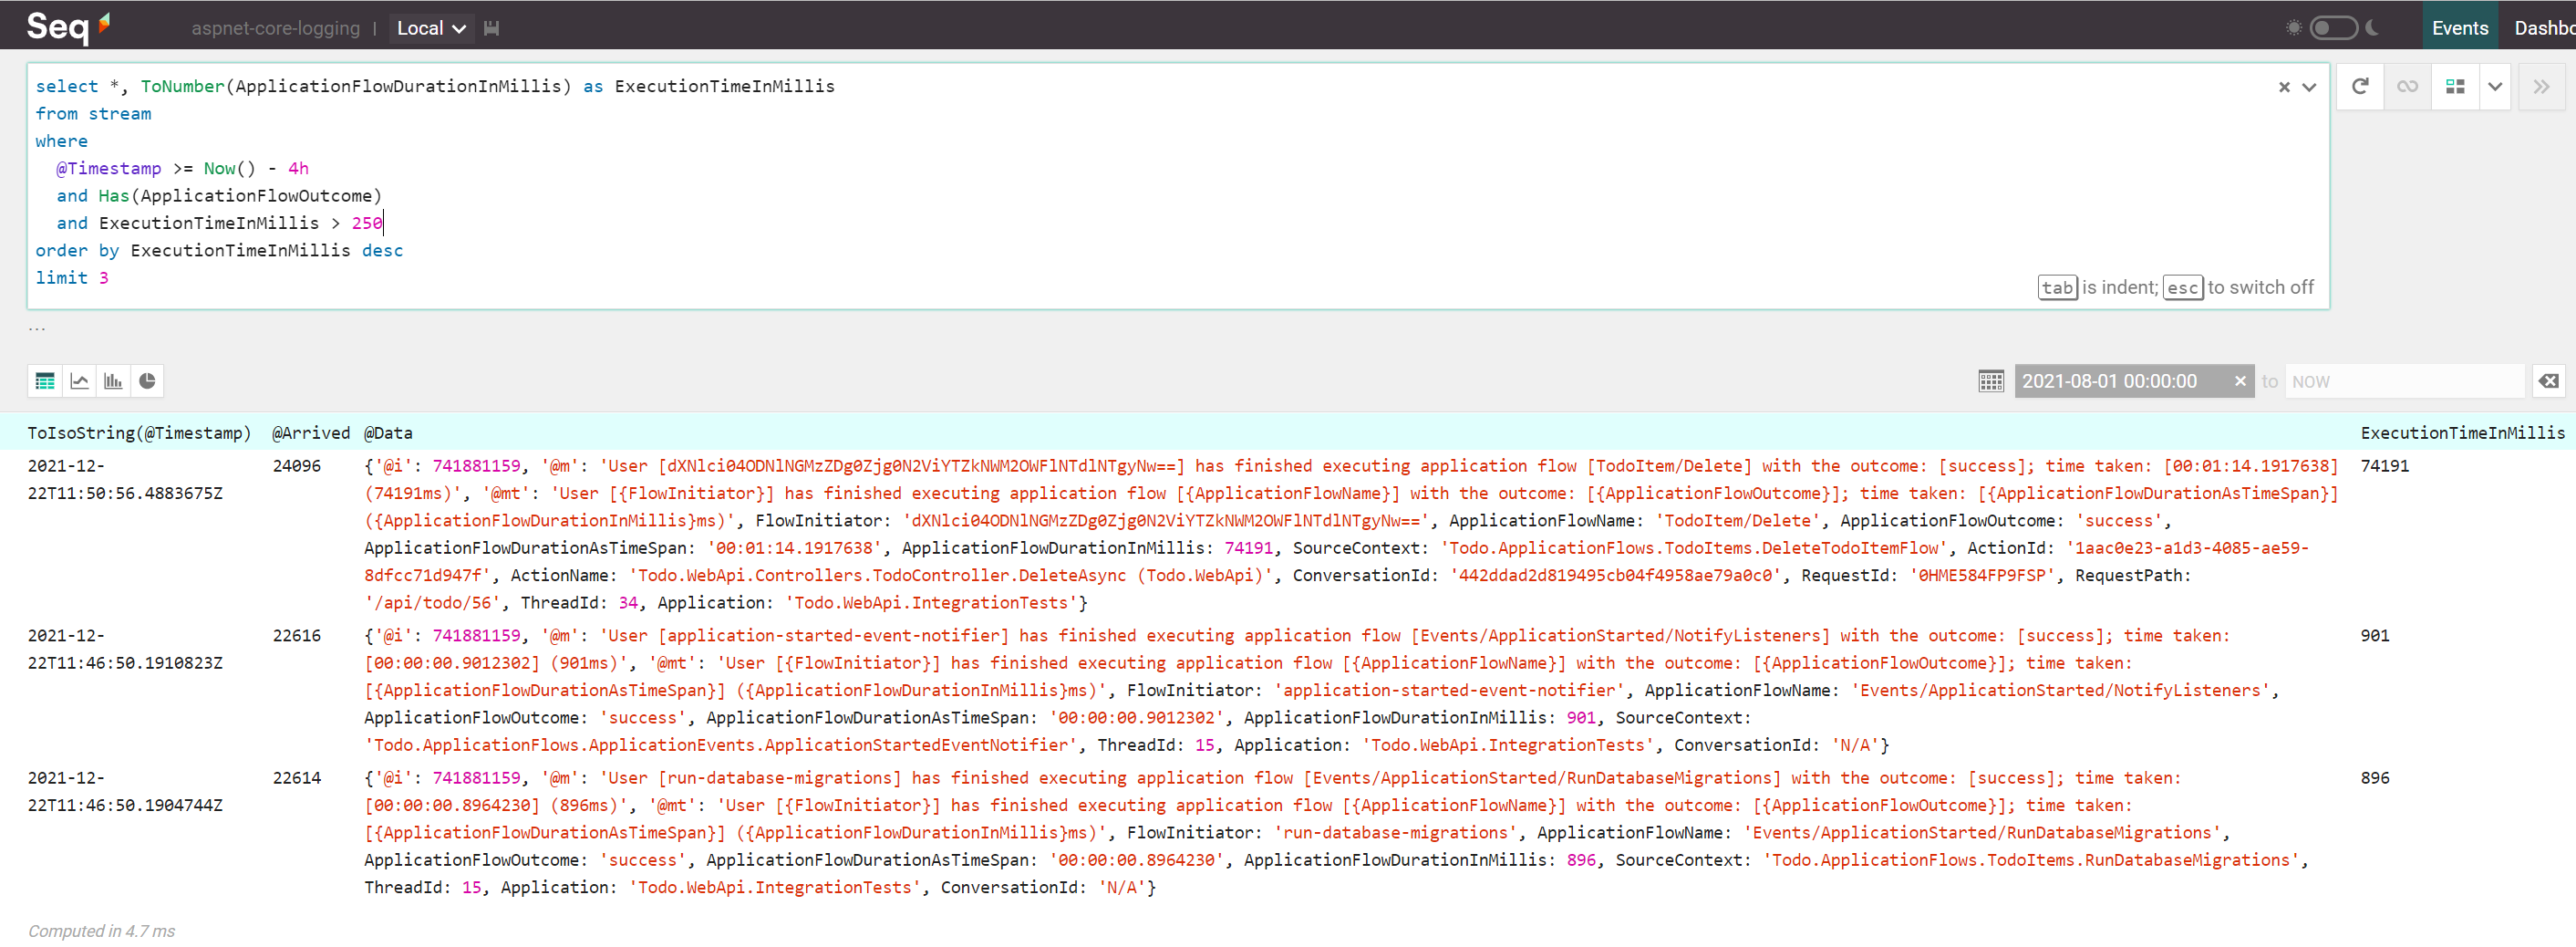
The first result (deleting a database row) has a rather unusual execution time (more than 70 seconds), so the developer should start improving the performance of the application by focusing first on optimizing this application flow.
(Well, this execution time is mostly due to debugging a test method on my machine, but that developer doesn’t know this yet)
References
- Logging in ASP.NET Core
- Serilog
- Reading
- Extensions
- Serilog Expressions
- Serilog.Extensions.Hosting
- Many, many others - just google them
- Alternatives
- Seq
- Reading
- Tools
- Alternatives
- ELK Stack
- Others
- Nicholas Blumhardt’s blog
Conclusion
Structured logging is not just for debugging purposes, as it can be used for various other purposes, like: spotting performance bottlenecks, auditing, analytics, distributed tracing and a lot more.
Using structured logging is definitely one of the best ways a developer can employ in order to help both business and technical stakeholders make better and more informed decisions to positively impact the outcome of a particular software system.
The only downside to structured logging I see right now is that you have to learn a new language for each server you are going to use for querying events, so for instance, you need to learn one when using Seq and another one when using Azure Application Insights, but I think the price is well worth it due to the amazing amount of information you can extract.
So what are you waiting for? Go put some structure into your events and query them like a boss!